
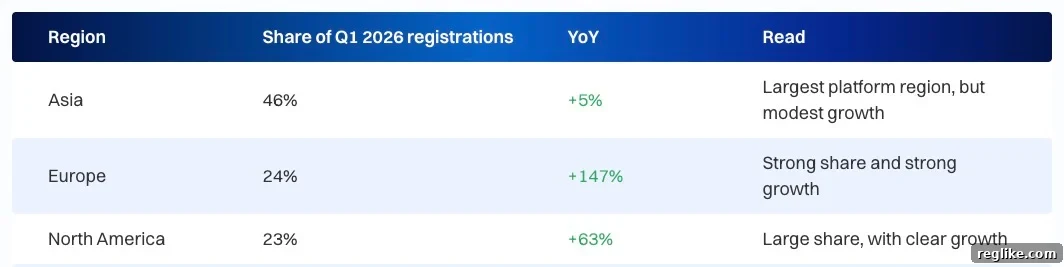
Asia accounted for about half of Dynadot’s registrations, but its growth is slower than in other regions.
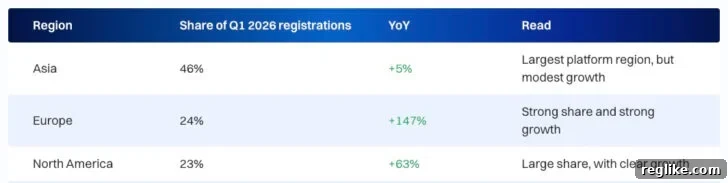
Dynadot recently released its Q1 Quarterly Intelligence Report. Although the report covers the first quarter and the business landscape has moved forward since then, the data provide a useful snapshot of customer behavior, geographic distribution, and domain trends at this registrar. The findings highlight how regional patterns and promotional pricing shape registration volumes and aftermarket activity.
Below is a clear, SEO-friendly summary of the report’s most relevant takeaways and what they indicate about Dynadot’s performance and market dynamics.
- Overall registration growth: Dynadot reported a strong year-over-year increase in registrations, with a 40% rise compared with the same period in the prior year. This growth was driven in large part by promotional pricing on specific top-level domains (TLDs) that appeal to cost-conscious customers and speculators alike.
- Top-performing TLDs: Many of the fastest-growing TLDs at Dynadot were those offered at discounted first-year prices. Examples cited include .digital, .info, .pro, and .sbs. These promotional offers can attract high volumes of initial registrations, especially among retail customers seeking an affordable online identity and investors looking to acquire inventory. Despite these gains, .com remained the most-registered TLD on the platform and showed a healthy 9% year-over-year increase—underscoring its continued dominance as the default choice for both businesses and individuals.
- Geographic breakdown and regional growth: Asia represented a substantial portion of Dynadot’s registrations—about 46%—making it the single largest source of customers by region. However, Asia’s growth rate was comparatively modest at 5% year over year. By contrast, Europe accounted for roughly 24% of registrations and experienced a strong 147% growth rate, while North America made up about 23% of registrations with a 63% increase. These regional differences suggest that some markets may be staging grounds for rapid expansion while others remain large but steady. For Dynadot, a significant base in Asia provides scale, and the higher growth in Europe and North America points to successful outreach or promotional effectiveness in those regions.
- Investor versus retail customer preferences: Dynadot segments its customer base into domain investors and retail users, and their preferences diverge beyond the universal popularity of .com. Among investors, .top ranked as the second-most-registered TLD, followed by .info and .vip—extensions that are often attractive in speculative portfolios. On the retail side, after .com, the more consumer-facing .digital and .sbs were popular choices. This split highlights how pricing, perceived resale potential, and local market tastes influence TLD selection for different buyer types.
- Aftermarket activity: The aftermarket at Dynadot in Q1 was dominated by .com, which accounted for 77% of transactions and grew 54% year over year. The next most active TLD in the aftermarket was .org at 5%. The aftermarket composition reinforces the central role of .com in domain transfers, resales, and premium listings, even as other extensions gain initial-registration volume through promotions.
- Registration term preferences: Most Dynadot customers choose one-year registrations when they first register a domain, a pattern common across registrars. An exception noted in the report is .dev, which leads among extensions for multi-year initial registrations at Dynadot, though only a small proportion—about 5%—of .dev registrations are for more than one year. Multi-year registrations can indicate stronger commitment or long-term project planning, but the prevailing one-year preference suggests flexibility remains a priority for many users.
The Q1 report offers a snapshot that helps explain how price promotions, regional markets, and buyer intent interact to shape registration and aftermarket activity at Dynadot. While Asia supplies a large share of overall volume, faster percentage growth in Europe and North America points to shifting momentum. Promotional first-year pricing continues to drive registration volume for niche and new TLDs, while .com maintains dominance in both primary registrations and aftermarket transactions.
For readers tracking registrar trends, these patterns are useful for understanding where demand is concentrated, which extensions are gaining traction, and how investor and retail behavior differs on Dynadot’s platform.