
Delving into the vast landscape of domain names, especially the highly coveted three-letter .com (LLL.com) domains, reveals a fascinating ecosystem of speculation, investment, and genuine end-user development. In this comprehensive guest article, Michael Robini offers an insightful analysis into the true percentage of LLL.com domains actively utilized by end-users, moving beyond mere ownership to understand practical application.
The scarcity and inherent value of LLL.com domains make them prime targets for investors and businesses alike. With only 17,576 possible combinations, these digital assets are often seen as premium real estate in the online world. But how many of these valuable domains are truly serving a purpose for an end-user, rather than being held for speculation or parking? This study aims to answer that precise question, offering a granular breakdown across carefully defined categories.
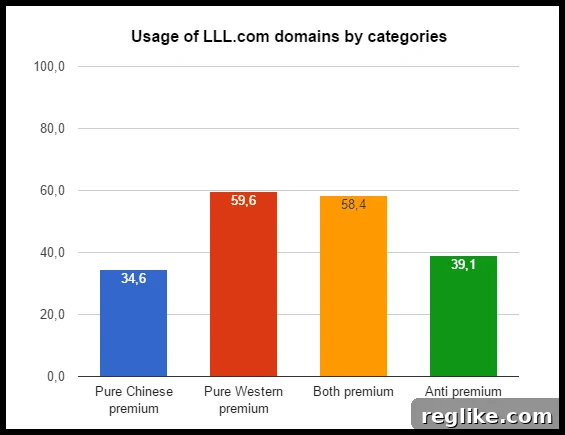
Our research indicates that the overall landscape of LLL.com usage by end-users is more varied than commonly perceived. Here’s a quick overview of our key findings, broken down by domain category:
- Pure Chinese Premium: 34.6% of these domains are actively used by end-users.
- Pure Western Premium: A significantly higher 59.6% are in active end-user development.
- Both Premium: Domains fitting both premium criteria show 58.4% end-user development.
- Anti Premium: This category, often considered less premium, still sees 39.1% end-user utilization.
When we consolidate these results, focusing on the broader Chinese premium and Western premium definitions, the figures offer a clearer market perspective:
- Chinese Premium (overall): 41.1% are developed by end-users.
- Western Premium (overall): A robust 59.1% are utilized by end-users.
Ultimately, synthesizing all our data, we find that 43.2% of all LLL.com domains are developed and actively used by end-users. This figure challenges some assumptions within the domaining community and provides a data-driven foundation for understanding the real-world application of these premium assets.
Unveiling the LLL.com Landscape: A Deep Dive into End-User Development
The market for three-letter .com (LLL.com) domains has long been a subject of fascination and considerable investment. These domains, inherently rare and often commanding high prices, represent a significant segment of the digital economy. While many studies focus on sales figures or market trends, a crucial question remains: how many of these highly valued assets are actually put to work by their ultimate users?
Before embarking on this extensive analysis of LLL.com domains, our team conducted two similar, in-depth studies on LLL.in domains. The initial research detailed our statistical methodology for determining developed websites, accessible here. A subsequent validation study, confirming the robustness and accuracy of our approach, can be found here. These foundational studies received positive feedback from the domaining community, prompting a specific request: to apply our proven methodology to the more complex and valuable LLL.com space, with a particular emphasis on domains developed by end-users.
This request also included a vital improvement: the stratification of the analysis based on specific ‘premium’ categories. Specifically, we were asked to differentiate between ‘Chinese premium’ domains—those typically favored in the Chinese market due to linguistic preferences (excluding letters A, E, I, O, U, and V)—and ‘Western premium’ domains—valued in Western markets for their pronounceability and memorability (excluding letters J, K, Q, U, V, W, X, Y, and Z). We enthusiastically embraced this challenge, recognizing that such a detailed breakdown would offer unparalleled insights for investors, businesses, and researchers across the global domain industry.
Our current study represents a rigorous blend of experimental analysis, sophisticated statistical modeling, and advanced computer science techniques. The methodologies employed here are highly adaptable and can be scaled to analyze various other domain categories, from four-letter .com (LLLL.com) domains to specific keyword-rich domain sets or numeric domains (NNNN.com). Throughout this article, we endeavor to meticulously detail each step of our process, making the calculation of end-user developed websites as transparent and replicable as possible. It is also important to acknowledge that the concept of analyzing LLL.com usage is not entirely new; pioneers like Nat Cohen have provided similar valuable figures in the past, contributing to the collective understanding of this dynamic market.
Defining the Terrain: LLL.com Domain Categories Explained
To conduct a precise and meaningful analysis, the first critical step involves systematically categorizing the entire universe of LLL.com domains. The total number of possible three-letter .com domains is a finite and manageable 26 x 26 x 26, equating to 17,576 unique combinations. Within this complete set, we established several key premium categories based on letter composition, reflecting distinct market preferences and values.
The Chinese premium category is defined by the absence of vowels (A, E, I, O, U) and the letter V. This is primarily due to the phonetic nature of the Chinese language, where such letter combinations are often considered less desirable or pronounceable. This definition yields 20 x 20 x 20 = 8,000 domains falling into this highly sought-after group.
Conversely, Western premium domains exclude letters typically considered difficult or less common in English and other Western languages (J, K, Q, U, V, W, X, Y, Z). These exclusions aim to identify domains that are easier to pronounce, remember, and brand. This criterion results in 17 x 17 x 17 = 4,913 domains.
A significant observation arises from the fact that an overlap exists between these two premium categories. For instance, a domain like DRT.com fits both the Chinese premium criteria (no A, E, I, O, U, V) and the Western premium criteria (no J, K, Q, U, V, W, X, Y, Z). These domains, which are inherently valuable in both major markets, form what we term the ‘both premium’ category. These domains are constructed exclusively from the letters B, C, D, F, G, H, L, M, N, P, R, S, T. Calculating these combinations reveals 13 x 13 x 13 = 2,197 such domains. This ‘both premium’ subset often represents the pinnacle of LLL.com value due to its universal appeal.
The introduction of the ‘both premium’ category naturally leads to the creation of two more precise subsets: ‘pure Chinese premium’ and ‘pure Western premium.’ The pure Chinese premium domains are those that are Chinese premium but *not* both premium, totaling 8,000 – 2,197 = 5,803 domains. Similarly, pure Western premium domains are those that are Western premium but *not* both premium, amounting to 4,913 – 2,197 = 2,716 domains. These ‘pure’ categories allow for a more refined analysis of market-specific preferences.
Finally, we are left with the remaining domains that do not fall into any of the premium categories. These are domains that are neither Chinese premium nor Western premium, and we designate them as ‘anti premium.’ This diverse group includes domains that contain Chinese premium but non-Western premium letters (J, K, Q, W, X, Y, Z), or Western premium but non-Chinese premium letters (A, E, I, O), or any combination including the letters U or V, as these two letters are excluded from both premium definitions. Specifically, we identified 3,108 domains mixing the first set of letters and 3,752 domains containing U or V. Together, these form a total of 3,108 + 3,752 = 6,860 anti premium domains. While sometimes considered less desirable, understanding their usage is crucial for a complete market picture.
To summarize, our comprehensive categorization divides the entire LLL.com universe into four distinct groups:
- Pure Chinese premium: A total of 5,803 domains.
- Pure Western premium: Comprising 2,716 domains.
- Both premium: A highly desirable group of 2,197 domains.
- Anti premium: The largest category, with 6,860 domains.
The sum of these categories (5,803 + 2,716 + 2,197 + 6,860) perfectly equals the total of 17,576 LLL.com domains. Given the sheer size of these individual categories, a direct, domain-by-domain analysis is impractical. Therefore, the subsequent stages of our methodology focus on smart, data-driven approaches to derive accurate insights.
Methodology Part 1: Filtering Out Domainer-Owned and Parked Domains
To accurately determine the percentage of LLL.com domains actively used by end-users, it’s crucial to first distinguish these developed sites from those held by domain investors or parked. This initial filtering step significantly reduces the dataset, allowing us to focus our analytical resources more efficiently. Our process began by removing domains that are clearly parked or under the control of domainers from the initial pool of 17,576 LLL.com domains.
The primary method for identifying parked domains and those belonging to domain investors involves examining their nameservers. Nameservers act as the internet’s phonebook, directing traffic for a domain. By retrieving the nameserver records for each LLL.com, we can identify patterns indicative of parking services or large-scale domain portfolios. For instance, nameservers containing identifiers like “SEDOPARKING.COM,” “PARKINGCREW.NET,” or “BODIS.COM” are clear indicators of a parked domain.
There are two principal ways to gather nameserver data:
- ‘Whois’ Command: This involves querying the whois database for each of the 17,576 domains. While this method is generally more precise, retrieving data for such a large volume of domains can be time-consuming and complex due to rate limits and variations in whois server responses.
- Scanning ‘Start Of Authority’ (SOA) Field: This faster and simpler approach involves querying a domain name server directly for the SOA record within the zone file. The SOA record typically contains primary nameserver information. However, this method can sometimes be less comprehensive or precise than a full whois lookup. More detailed information about zone files and SOA records can be found on Wikipedia’s Zone file entry.
For this LLL.com study, conducted on May 13, 2016, we opted for the ‘whois’ approach to ensure the highest level of accuracy for our dataset. This meticulous data collection yielded a comprehensive list of nameservers for every LLL.com domain, which we then aggregated to identify common parking providers and known domain investor portfolios.
Our analysis of the top 20 most frequently occurring nameservers provided significant insights into the landscape of LLL.com ownership:
| Rank | Number of LLL.com | Nameserver value | Parking Company or Domainer |
|---|---|---|---|
| 1 | 1,104 | DNS1.IIDNS.COM | No |
| 2 | 1,080 | BUY.INTERNETTRAFFIC.COM | Yes |
| 3 | 1,071 | NS1BQX.NAME.COM | Yes (Well known investor) |
| 4 | 429 | NS1.SEDOPARKING.COM | Yes |
| 5 | 385 | NS1.ABOVE.COM | Yes |
| 6 | 345 | PDNS01.DOMAINCONTROL.COM | No (GoDaddy) |
| 7 | 312 | NS41.ROOKDNS.COM | Yes |
| 8 | 308 | F1G1NS1.DNSPOD.NET | No (DNS Hosting Provider) |
| 9 | 294 | NS1.4.CN | Yes |
| 10 | 239 | DNS1.NAME-SERVICES.COM | No (Enom) |
| 11 | 196 | NS1.PARKINGCREW.NET | Yes |
| 12 | 159 | NS1.DNSNAMESERVICE.COM | Yes (Investor, Gotw.com DNS Hosting) |
| 13 | 157 | NS1.DATINGOPINIONS.COM | No |
| 14 | 155 | NS3.DOTZUP.COM | Yes |
| 15 | 153 | NS0.DNSMADEEASY.COM | No (DNS Hosting Provider) |
| 16 | 114 | NS1.BODIS.COM | Yes |
| 17 | 109 | NS1.SMARTNAME.COM | Yes |
| 18 | 106 | NS1.DSREDIRECTION.COM | Yes |
| 19 | 102 | NS1.DREAMHOST.COM | No |
| 20 | 99 | NS1.DIGIMEDIA.COM | Yes (Investor) |
By summing the domains associated with known parking companies or prominent domain investors (marked with ‘Yes‘ in the table), we identified a substantial portion of the LLL.com universe. This sum amounts to 1,080 + 1,071 + 429 + 385 + 312 + 294 + 196 + 159 + 155 + 114 + 109 + 106 + 99 = 4,509 domains. This critical finding indicates that at least 4,509, or 25.7% of all LLL.com domains, were either parked or demonstrably in the hands of domain investors as of May 13, 2016.
It’s important to note that this figure represents a conservative estimate, as other domains might be parked with smaller, less-known providers, or not resolving at all, making their ownership status ambiguous. The remaining 13,067 domains from the original 17,576 either resolve to developed websites, redirect to other sites, or are currently under construction. Our subsequent analysis focuses specifically on identifying which of these remaining domains are genuinely developed and actively used by end-users, rather than being speculative holdings or undeveloped assets.
Methodology Part 2: Determining a Representative Sample for Accurate Insights
Following the initial filtering, we were left with a significant pool of 13,067 LLL.com domains that were not overtly parked or identified as domainer-owned. Our next step was to distribute these domains into the four distinct categories established earlier in Part 3: pure Chinese premium, pure Western premium, both premium, and anti premium. This breakdown yielded the following numbers for each category of non-parked domains:
- Pure Chinese premium (non-parked): 4,416 domains.
- Pure Western premium (non-parked): 2,243 domains.
- Both premium (non-parked): 1,819 domains.
- Anti premium (non-parked): 4,589 domains.
As expected, the sum of these non-parked groups (4,416 + 2,243 + 1,819 + 4,589) equals 13,067, precisely the number of domains remaining after our initial filtering process. Even within these refined categories, the number of domains remains too large for a manual, domain-by-domain inspection. To accurately determine the percentage of developed websites within each group without examining every single domain, we employed a robust statistical sampling methodology.
Statistical sampling allows us to analyze a smaller, representative subset of a larger population and confidently extrapolate the findings to the entire group, within a specified margin of error and confidence level. This approach is widely used in scientific research and market analysis to gather reliable data efficiently. For those interested in the underlying principles, detailed information on determining appropriate sample sizes can be found on resources like Wikipedia’s Sample Size Determination and through practical tools like the SurveyMonkey Sample Size Calculator.
To ensure the validity and reliability of our findings, we set specific parameters for our statistical samples. We aimed to evaluate the number of developed domains with an acceptable error margin of 3% and a high confidence factor of 95%. This means that if we were to repeat the study multiple times, we would expect our results to be within 3% of the true population value 95% of the time. Based on these parameters, the required minimum sample size for each domain category was calculated as follows:
- Pure Chinese premium: A sample of 860 domains.
- Pure Western premium: A sample of 724 domains.
- Both premium: A sample of 673 domains.
- Anti premium: A sample of 866 domains.
These calculated sample sizes ensure that our manual review of domains provides statistically significant results, allowing us to confidently project the development rates to the entire population of LLL.com domains within each category.
Automated Analysis and Defining “Developed” End-User Websites
Even with statistically determined sample sizes, manually inspecting hundreds of websites per category is a laborious and time-consuming process. Opening each URL, waiting for pages to load, and visually assessing content can introduce inefficiencies and potential for human error. To streamline this critical phase of our analysis, we developed a specialized tool designed to efficiently capture visual data from a list of domains.
Our custom tool leveraged the power of the Selenium automation framework in conjunction with the PhantomJS headless web browser driver. This setup allowed us to programmatically navigate to each domain in our samples and take full-page screenshots of the websites. By automating the screenshot generation, we transformed the task from individual website visits into a more manageable review of batches of images. This method significantly reduced the time required for visual inspection, allowing our team to focus solely on the qualitative assessment of each domain’s content.
A crucial aspect of this study involved establishing a clear and consistent definition of what constitutes a “developed website owned and used by an end-user.” Given the subjective nature of website content, precise criteria were essential to ensure uniformity in our evaluation. Below are the detailed guidelines we followed:
- Standard Developed Website: Any website, regardless of its complexity or aesthetic quality, that presents unique content and serves a discernible purpose (e.g., a business site, a personal blog, a portfolio) is considered owned and used by an end-user. This includes even simple one-page sites, provided they are not generic templates.
- Redirects to Developed Sites: If a sampled LLL.com domain permanently redirects to another domain that itself qualifies as a developed end-user website, the LLL.com domain is also classified as being in end-user use. This acknowledges its active role in directing traffic to an operational site.
- Template Pages / Generic Content: Domains displaying generic template pages, placeholder content, or content that can be found identically on numerous other domains are NOT considered in use by an end-user. These are typically associated with domain investors holding a portfolio of undeveloped sites.
- “For Sale” / Contact Forms: Domains explicitly displaying “For Sale” notices, elaborate contact forms as their sole content, or direct advertisements for sale are NOT classified as end-user developed. These indicate a speculative or transactional intent rather than active use.
- Non-Resolving Domains: Domains that do not resolve to any active website (e.g., DNS errors, server not found) are NOT considered developed by an end-user. They are essentially inactive.
- Parked Domains: While many parked domains were filtered in an earlier stage, if any inadvertently remained or were not identified by nameserver analysis, they were also NOT considered end-user developed. Parked domains serve as placeholders, often generating ad revenue, rather than offering unique content.
With these rigorous definitions in place, we proceeded with the analysis of our samples. For the initial group of 4,416 non-parked pure Chinese premium domains, we randomly selected a sample of 860 domains using the Unix ‘shuf’ command to ensure unbiased representation. After capturing screenshots, our team meticulously reviewed these images. From this sample of 860, we identified 391 domains that met our criteria for being developed by an end-user. This translates to 45.5% of the pure Chinese premium sample being developed.
Extrapolating this percentage to the entire group of 4,416 non-parked pure Chinese premium domains (4,416 * 0.455), we estimate that approximately 2,009 domains are developed. Finally, to determine the percentage within the full category of 5,803 pure Chinese premium domains (including those initially identified as parked or domainer-owned), we calculate (2,009 / 5,803) * 100%, which results in 34.6% of pure Chinese premium domains being developed websites.
This systematic process was then replicated for the remaining three domain categories: pure Western premium, both premium, and anti premium. The comprehensive results, reflecting the percentage of developed websites within each full category (including parked/domainer-owned domains), are as follows:
- Pure Chinese premium: 34.6% of developed websites.
- Pure Western premium: 59.6% of developed websites.
- Both premium: 58.4% of developed websites.
- Anti premium: 39.1% of developed websites.
Conclusion: Unveiling the Overall Picture of LLL.com Usage
The final stage of our extensive study involves synthesizing the detailed findings from each domain category to present a holistic view of LLL.com domain usage by end-users. Our analysis began with a clear understanding of the distribution of domains across the four defined categories, along with their respective end-user development percentages:
- Pure Chinese premium: Out of 5,803 domains, 34.6% are used by end-users.
- Pure Western premium: Out of 2,716 domains, 59.6% are used by end-users.
- Both premium: Out of 2,197 domains, 58.4% are used by end-users.
- Anti premium: Out of 6,860 domains, 39.1% are used by end-users.
To provide broader insights relevant to the domain market, we further consolidated these results into overall ‘Chinese premium’ and ‘Western premium’ categories. This required merging the ‘both premium’ percentage with its respective ‘pure Chinese’ and ‘pure Western’ counterparts. The calculations are as follows:
- Overall Chinese premium: The total number of Chinese premium domains is 8,000 (5,803 pure + 2,197 both). The percentage of developed domains is calculated as:
[(34.6% X 5,803) + (58.4% X 2,197)] / 8,000 = 41.1%
This means that 41.1% of all Chinese premium LLL.com domains are developed by end-users. - Overall Western premium: The total number of Western premium domains is 4,913 (2,716 pure + 2,197 both). The percentage of developed domains is calculated as:
[(59.6% X 2,716) + (58.4% X 2,197)] / 4,913 = 59.1%
This indicates that a robust 59.1% of all Western premium LLL.com domains are actively used by end-users.
Finally, to arrive at the overall percentage of all LLL.com domains developed by end-users, we combined the developed counts from all four distinct categories and divided by the total number of LLL.com domains (17,576):
[(34.6% X 5,803) + (59.6% X 2,716) + (58.4% X 2,197) + (39.1% X 6,860)] / 17,576 = 43.2%
Our comprehensive analysis reveals that 43.2% of the entire LLL.com domain space is actively developed and utilized by end-users.
It is critical to interpret this 43.2% figure with nuance. It does not imply that the remaining 100% – 43.2% = 56.8% of LLL.com domains are exclusively in the hands of domain investors. The reality is more complex:
- Some domains we identified as ‘parked’ might indeed be owned by end-users who have simply not yet developed them. Their intent could be long-term personal or business use rather than pure speculation.
- Approximately 15% of all LLL.com domains were found to be non-resolving. For these domains, it’s impossible to definitively ascertain whether they belong to end-users with technical issues or domainers holding undeveloped assets.
Considering these factors, we can confidently conclude that domain investors own less than 56.8% of LLL.com domains. A more realistic estimate, assuming that non-resolving domains are roughly split between end-users and investors, would suggest that domainers likely own less than 50% of the LLL.com market. This finding offers valuable perspective for both buyers seeking developed domains and investors evaluating the true potential and utilization rates within their portfolios.
We extend our sincere gratitude to Nat Cohen for his insightful discussions, invaluable advice, and meticulous review of this article. His expertise significantly contributed to the depth and accuracy of this study.
We also thank Andrew for graciously agreeing to publish this analysis on Domain Name Wire, providing a vital platform to share these findings with the broader domaining community.
It is important to state that while we employ rigorous analytical methods, our team comprises researchers with diverse backgrounds, and we are not exclusively certified IT experts or mathematicians. We welcome any constructive feedback or identification of potential errors in the study’s methodology or calculations, as continuous improvement is always our aim. For those interested in further details, all raw data, samples, and software components utilized in this research are available upon request.