
The digital landscape is in constant flux, and within it, the .com domain stands as a venerable cornerstone. While recent discussions have hinted at a significant slowdown in its growth, a meticulous examination of the underlying data reveals a more nuanced reality: the .com growth rate is indeed experiencing a slight reduction, yet its overall expansion remains robust, consistently exceeding 8% per year. This article delves beyond superficial headlines to provide an in-depth analysis of .com registration trends, uncovering the true dynamics of its evolution.
A few weeks prior, the domain industry buzzed with observations suggesting a dramatic deceleration. Michael Berkens, a respected voice in the community, penned a story articulating concerns that the registration base for .com and .net domains was slowing “to a crawl.” This sentiment was echoed days later when Treffis issued a report, confidently stating that “Verisign’s Dropping .com And .net Is A Troubling Trend.” Such pronouncements naturally spark concern among stakeholders, from domain investors to digital marketers and businesses relying on these foundational online identities.
However, the numbers presented in some of these reports immediately raised questions. The figures in Berkens’ initial post seemed to lack the comprehensive context needed for a clear interpretation. Similarly, the Treffis report highlighted a falling market share for .com and .net, which, while factually correct given the proliferation of new generic Top-Level Domains (gTLDs), didn’t necessarily paint a complete picture of the overall namespace’s continued expansion. A decrease in market share doesn’t automatically equate to a decrease in absolute growth, especially when the total pie is continuously expanding. Driven by a desire to understand the authentic trajectory of the .com domain, a deeper investigation into the core data became imperative.
The Criticality of “Apples to Apples” Data Comparison in Domain Analysis
One of the most significant insights gained from this investigation is the crucial importance of comparing data sets that are truly “apples to apples.” The domain industry, particularly when dealing with registration figures, can be rife with discrepancies due to varying reporting methodologies. What VeriSign reports on its public zone file page, for instance, often differs from the statistics shared in its quarterly domain industry briefs and investor calls. These, in turn, can diverge from the numbers VeriSign submits to ICANN each month. These variations are not necessarily indicative of inaccuracies but rather stem from different reporting scopes and definitions.
For example, a common point of divergence lies in the exclusion or inclusion of domains within the five-day “add-grace period.” This grace period allows registrars to register a domain name and then delete it within five days without incurring a fee. While vital for operational flexibility, including or excluding these transient registrations can significantly skew short-term growth figures. If one compares numbers from a zone file, which might capture real-time, often unprocessed data, to VeriSign’s other reports that filter out domains in the grace period, the resulting growth rates will inevitably be inconsistent and potentially misleading. Such inconsistencies highlight why relying on a single, consistently reported data source is paramount for accurate trend analysis.
Perhaps the most reliable and consistent monthly source of information regarding .com registrations comes from the detailed reports VeriSign sends directly to ICANN. These reports are meticulously compiled, publicly accessible, and provide an extensive historical archive, allowing researchers and analysts to trace trends back as far as needed with a standardized methodology. By utilizing these ICANN reports, it becomes possible to establish a truly “apples to apples” comparison, eliminating the noise introduced by varying reporting practices across different VeriSign publications. For this analysis, I meticulously compiled the end-of-quarter monthly ICANN reports, focusing exclusively on .com registrations, dating back to the first quarter of 2009, to ensure a robust and consistent data foundation.
A Deep Dive into .COM Growth: What the ICANN Data Reveals
Upon scrutinizing the comprehensive data from VeriSign’s ICANN reports, a clear pattern emerged regarding the growth rate of the .com registration base. While the initial reports suggested a dramatic slowdown, the reality is more nuanced: the annual growth rate has been experiencing a marginal, gradual deceleration over the past several years. This isn’t a sudden halt but rather a gentle easing off the accelerator.
Annual Growth Rate: A Subtle Shift, Not a Steep Decline
The chart below vividly illustrates the annual growth rate in the .com base. As is evident, the trajectory has been on a slight downward slope since the third quarter of 2010. While any downward trend naturally warrants attention, it’s crucial to contextualize the magnitude of this shift. The drop in the growth rate (it’s essential to reiterate, this is a drop in the *rate of growth*, not a decline in the *total number of domains registered*) has been remarkably small. From one quarter to the next, this deceleration has been as little as three basis points and no more than 25 basis points (a quarter of a percentage point). This subtle adjustment follows a period of robust growth, particularly after a challenging phase impacted by falling domain parking revenues, which had temporarily depressed the market.
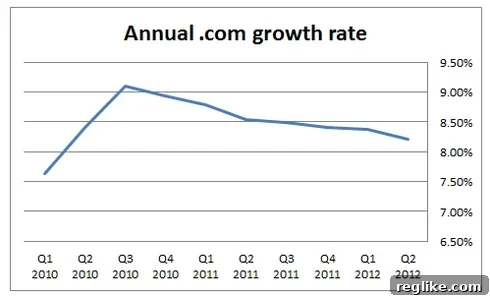
It’s also imperative to consider the “Law of Large Numbers” when interpreting these figures. As the .com base continues to expand and grow exponentially larger, maintaining the same percentage growth rate becomes increasingly challenging. A 10% growth rate on a base of 50 million domains requires 5 million new registrations, whereas a 10% growth on a base of 100 million domains demands 10 million new registrations. Even with a slightly slower overall growth rate, the sheer number of net gains in 2011, for example, actually surpassed those recorded in 2010. This indicates that the domain name space is still adding a substantial volume of new .com registrations annually, even as its growth rate normalizes amidst its colossal scale. The absolute number of domains being added continues to impress, underpinning the enduring appeal of .com.
The Expanding .COM Base: Visualizing Overall Growth
To further contextualize the growth narrative, it is helpful to visualize the absolute size of the .com base, as reported to ICANN, over time. The chart below, beginning at zero, offers a clear perspective on the relentless expansion of .com registrations since the first quarter of 2009. This upward curve is a testament to the domain’s fundamental strength and continuous appeal, illustrating that despite any minor fluctuations in its growth *rate*, the total number of .com domains in existence continues its steady and impressive climb.
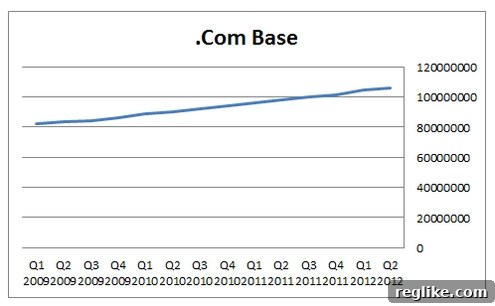
This steady increase reinforces the idea that .com is not contracting or even stagnating; rather, it’s expanding at a pace that, while perhaps not matching its peak percentage growth, is still robust in absolute terms. The market is not experiencing a “crawl” but rather a mature, sustained expansion befitting a sector that has achieved significant global saturation and universal recognition.
Quarterly Dynamics: Understanding Seasonal Fluctuations
While annual growth rates provide a stable long-term view, attempting to compare the growth rate of the .com base from quarter to quarter can be somewhat misleading without accounting for inherent seasonality. Domain registrations, much like many economic activities, exhibit seasonal patterns. For instance, the first quarter (Q1) consistently emerges as a strong period for growth, often benefiting from year-end budget allocations and renewed business initiatives. Other quarters might experience different patterns based on global holidays, economic cycles, or marketing campaigns.
To accurately represent this more granular data and account for seasonal variations, presenting it in a tabular format is often most effective. This allows for a quarter-over-quarter comparison that implicitly acknowledges these cyclical trends, making it easier to spot underlying shifts rather than being distracted by predictable seasonal highs and lows.
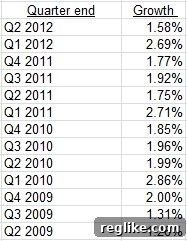
Even within these quarterly figures, after accounting for seasonality, the subtle downward trend in the growth rate remains discernible. It reinforces the observation from the annual data: the .com market is maturing, and its percentage growth is naturally moderating. However, it’s critical to remember that “moderating growth” is vastly different from “declining numbers” or “stagnation.” The base continues to expand, reflecting continuous demand.
The Enduring Strength: Why .COM Continues to Thrive
The bottom line derived from this comprehensive data analysis is unequivocal: growth in the .com base is indeed slowing, but this deceleration is occurring at an extremely marginal pace. More importantly, the .com domain remains a powerfully expanding entity, continuing to grow significantly year after year. The narrative of a market “slowing to a crawl” or facing a “troubling trend” is largely an overstatement, perhaps born from misinterpreting data or comparing inconsistent metrics.
It’s worth noting a limitation of VeriSign’s data submitted to ICANN: it is typically posted three months in arrears. This time lag means that real-time market shifts might not be immediately reflected. However, other independent sites that track .com counts based on zone information—which offers a more immediate snapshot—corroborate this analysis, showing that while the reduced growth trend is indeed continuing, it is doing so modestly. These real-time trackers confirm that the overall positive trajectory of .com registrations remains intact, solidifying its position as the undisputed leader in the domain space.
New TLDs vs. The .COM Goliath: A Future Outlook
The advent and proliferation of new Top-Level Domains (TLDs) have introduced a fascinating dynamic into the domain industry. Many proponents of these new alternatives envisioned them taking a substantial bite out of .com’s growth rate, fundamentally reshaping the digital landscape. Their reasoning is sound: with hundreds of new extensions like .app, .store, .tech, and city-specific TLDs, businesses and individuals now have an unprecedented array of choices beyond the traditional .com, .net, and .org. In the long term, this diversified market could indeed begin to fragment the market share and potentially dampen .com’s growth trajectory.
However, for now, the data clearly indicates that .com’s registration base continues its robust and healthy expansion. While new TLDs have found their niches and are collectively growing, they have yet to significantly impact the absolute growth of .com. The enduring trust, recognition, and universal acceptance of .com remain unparalleled. It is the default choice for businesses and individuals seeking a global, authoritative online presence. The brand equity accumulated over decades for .com is immense and not easily eroded by newer, albeit innovative, alternatives.
The future of the domain market will undoubtedly be shaped by these evolving dynamics. As internet penetration increases globally and digital identities become even more critical, the demand for domain names, in general, is likely to continue rising. Whether new TLDs eventually carve out a larger piece of the *absolute* growth, rather than just market *share*, remains to be seen. But for the foreseeable future, the .com domain stands resilient, its growth trajectory steady, and its position as the internet’s premier address firmly intact.
Conclusion: A Measured Perspective on .COM’s Enduring Future
In conclusion, while alarmist headlines might suggest otherwise, a thorough and consistent analysis of VeriSign’s data submitted to ICANN reveals that the .com domain is not in decline, nor is its growth slowing to a negligible rate. Instead, it is experiencing a marginal and predictable deceleration in its *percentage growth rate*, a natural phenomenon for a mature and massive market. The absolute number of .com registrations continues to increase significantly, demonstrating its unwavering demand and integral role in the digital economy.
The subtle shifts observed are important for industry analysts and investors to track, but they should not overshadow the overarching narrative of .com’s enduring strength. Despite the emergence of numerous new TLDs and evolving market conditions, .com maintains its unparalleled status as the most trusted and recognized domain extension globally. Its resilience and sustained expansion underscore its foundational importance to the internet, ensuring that it will remain the cornerstone of online identity for years to come. The .com domain isn’t just surviving; it’s thriving with a measured, consistent momentum that solidifies its legacy as the ultimate address on the World Wide Web.