
Unmasking Cybersquatting Hotspots: A Deep Dive into WIPO UDRP Statistics and Geographic Trends
In the evolving digital landscape, protecting one’s brand identity online is paramount. One of the most persistent threats to this digital presence is cybersquatting – the abusive registration of domain names that are identical or confusingly similar to trademarks. The Uniform Domain-Name Dispute-Resolution Policy (UDRP), administered by bodies like the World Intellectual Property Organization (WIPO), serves as a crucial mechanism for trademark holders to reclaim such infringing domain names.
WIPO, a leading global arbiter of domain name disputes, distinguishes itself by diligently publishing comprehensive statistics on the cases it handles. These robust data sets offer invaluable insights into the global patterns of cybersquatting, helping businesses and legal professionals understand the landscape of online brand infringement. Unlike some of its counterparts, such as the National Arbitration Forum, WIPO’s commitment to transparency provides a unique opportunity to analyze trends, particularly the geographic distribution of alleged cybersquatters, also known as respondents.
While these statistics paint a broad picture, drawing definitive conclusions requires careful consideration of several important caveats. This article delves into WIPO’s fascinating data on respondent locations, examines how these findings compare to complainant locations, and explores a compelling per capita analysis that dramatically alters our understanding of cybersquatting prevalence.
Understanding the Global Footprint of Cybersquatting Respondents
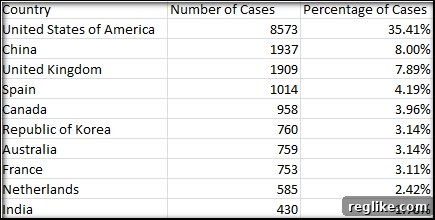
WIPO’s statistics on the location of UDRP respondents offer a compelling snapshot of where alleged cybersquatters reside. These individuals or entities are identified as the registrants of domain names that trademark owners claim infringe upon their rights. Analyzing these locations provides an initial understanding of the regions where such activities are most frequently reported and disputed.
The initial data often highlights countries with significant internet user bases or those that are major hubs for domain registration and web hosting services. Historically, countries like the United States and China frequently feature prominently in these lists, often reflecting their vast digital economies and the sheer volume of online activity originating from within their borders. While the specific rankings can fluctuate year by year, the consistent appearance of certain nations underscores their ongoing relevance in the global fight against cybersquatting.
To fully appreciate the nuances of these figures, it’s essential to acknowledge the critical caveats WIPO itself implicitly or explicitly suggests. These disclaimers prevent us from making oversimplified generalizations and encourage a more sophisticated interpretation of the data.
Key Caveats for Interpreting Respondent Location Data
- Inclusion of All Cases: WIPO’s reported statistics encompass all UDRP cases filed, regardless of their outcome. This means the data includes instances where the complainant ultimately did not prevail. However, it’s worth noting that trademark holders tend to win a significant majority of UDRP disputes, suggesting that the respondent location data still largely reflects actual instances of cybersquatting. Nevertheless, a small percentage of cases where respondents were ultimately cleared could slightly inflate the figures for certain regions.
- Self-Reported Addresses and Privacy Services: The reported locations are based on the addresses provided by the domain registrants themselves. This introduces a potential for inaccuracy. Registrants might provide false addresses to obfuscate their true identity or location. Furthermore, the increasing use of privacy and proxy services, which allow domain owners to mask their personal information in public WHOIS records, can significantly skew these statistics. When a privacy service is used, the listed address might belong to the service provider, often located in a jurisdiction different from the actual domain registrant. This makes it challenging to pinpoint the true geographic origin of the cybersquatting activity.
- Scope of Cases (ccTLDs): It remains somewhat unclear whether WIPO’s aggregated numbers for respondent locations consistently include cases filed under variations of the UDRP policy specifically for country code Top-Level Domains (ccTLDs). While WIPO does administer disputes for many ccTLDs, the specific rules and reporting methodologies can sometimes differ. If ccTLD cases are not fully integrated or are counted differently, it could affect the overall representation of certain countries, particularly those with highly active ccTLD registrations.
Despite these critical considerations, the raw data provides an invaluable starting point for understanding the global distribution of UDRP respondents. The visuals, often provided by WIPO, vividly illustrate these initial rankings:
Comparing Respondent Locations to Complainant Origins
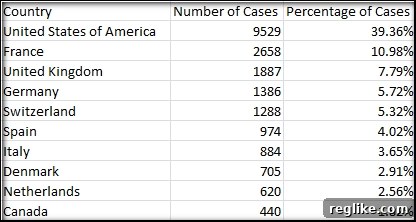
An equally insightful dimension to this analysis involves comparing the geographic origins of the alleged cybersquatters (respondents) with those of the trademark holders who file the UDRP complaints (complainants). This comparison can reveal interesting patterns about where intellectual property is most actively being protected and from where these protective actions originate.
Often, countries with robust economies, strong legal frameworks, and a high concentration of multinational corporations, such as the United States and various European nations, tend to be major sources of UDRP complaints. This suggests a proactive stance by brand owners in these regions to safeguard their digital assets. When juxtaposed with respondent locations, this data can highlight cross-border cybersquatting trends, indicating which countries are frequently targeted by infringers from different jurisdictions.
For instance, if a significant number of complaints originate from Country A, but a substantial portion of respondents are located in Country B, it might indicate a specific pattern of infringement targeting brands from Country A by individuals or entities in Country B. This information is crucial for brand owners developing international enforcement strategies, allowing them to focus resources on regions where their intellectual property is most at risk or where enforcement actions are most frequently needed.
The visual representation of complainant locations further illuminates these dynamics:
A Radical Shift: The Per Capita Perspective on Cybersquatting Prevalence
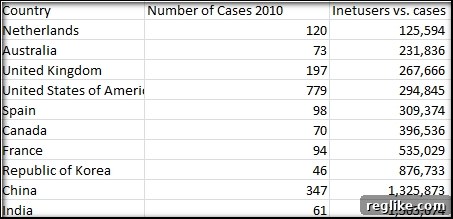
While raw numbers of UDRP cases by country provide a baseline understanding, they can be misleading. A country with a massive internet-connected population will naturally generate more activity, including potentially more instances of cybersquatting, simply due to scale. Recognizing this, a more nuanced analysis involves normalizing the UDRP filing data against the number of internet users in each country. This per capita approach, often prompted by insightful observations from experts like John Berryhill, can radically alter our perception of where cybersquatting is most prevalent on a relative basis.
By comparing the number of WIPO UDRP filings to the total number of internet users in a given country, we can gain a “density” measure of cybersquatting activity. This methodology aims to identify regions where, relative to their online population, there’s a disproportionately high or low incidence of reported domain name disputes. For instance, a country with a vast number of internet users might have a high absolute number of UDRP cases, but when divided by its user base, the per capita rate might be quite low, suggesting that cybersquatting is not as pervasive relative to its digital engagement.
Indeed, applying this per capita lens often leads to a dramatic reshuffling of the rankings. Countries that appear high on the absolute list, such as China, might plummet significantly when their enormous internet user base is factored in. Conversely, smaller nations with fewer internet users but a considerable number of UDRP filings could rise in the adjusted rankings, indicating a relatively higher propensity for cybersquatting activities per online individual.
Important Considerations for the Per Capita Analysis
While offering a more refined perspective, this per capita analysis is not without its own set of methodological limitations and should be interpreted with caution. It serves as a valuable indicator but not an absolute measure of cybersquatting intensity.
- Limited Scope of Countries: Often, this type of analysis is initially performed only on the top-ranking countries from the absolute respondent list. This means many other countries are not included, and if they were, the rankings could shift further. It’s plausible that some smaller nations not initially in the top 10 might exhibit extremely high per capita rates if a few active cybersquatters reside there.
- WIPO Data Exclusivity: This analysis typically relies solely on WIPO’s UDRP case numbers. However, WIPO is not the only provider of UDRP-like services. The National Arbitration Forum (NAF), for example, also handles a substantial volume of domain name disputes, particularly within the United States. Ignoring NAF cases could significantly underrepresent the true number of UDRP filings for countries like the U.S., potentially doubling their actual case numbers. Similarly, regional providers, such as those in Asia that handle ccTLD disputes, might add to China’s figures. Therefore, a truly comprehensive global per capita analysis would need to consolidate data from all accredited dispute resolution providers.
- Impact of Repeat Offenders: A single individual or entity can be responsible for a large number of cybersquatting cases. In a per capita calculation, this can artificially inflate the “prevalence” for a country if one prolific cybersquatter accounts for many disputes. The numbers don’t differentiate between unique alleged infringers and repeat offenders.
- Data Lag: The availability of up-to-date internet user statistics can also be a challenge. Often, the most recent reliable data for internet penetration comes from sources like the World Bank, which might have a lag of a year or two. Matching these figures with UDRP case numbers from the exact same period is crucial for accuracy, but sometimes approximations are necessary. For instance, comparing 2010 World Bank internet user numbers with 2010 WIPO case filings offers a snapshot, but continuous, real-time data is hard to achieve.
Despite these complexities, the per capita analysis provides a compelling alternative viewpoint, challenging initial assumptions derived from raw numbers alone. It encourages a deeper look into the underlying dynamics of online brand infringement and highlights the varying rates of cybersquatting relative to a nation’s digital population.
Strategic Implications for Global Brand Protection
The detailed analysis of WIPO’s UDRP statistics, encompassing both absolute and per capita views of cybersquatting, offers profound strategic implications for businesses and trademark holders worldwide. Understanding the geographic hotspots, both in terms of raw infringement volume and relative prevalence, is critical for developing effective and targeted brand protection strategies.
For multinational corporations, this data can inform where to prioritize monitoring efforts, legal counsel, and enforcement actions. If a particular country consistently ranks high in respondent locations, regardless of the metric, it signals a jurisdiction where intellectual property might be more frequently targeted or where local enforcement challenges exist. Conversely, understanding the origins of complainants can help legal teams anticipate the jurisdictions from which their clients might face disputes.
Moreover, the per capita analysis underscores that sheer volume of internet users does not automatically equate to a higher relative risk of cybersquatting. Instead, it points to specific regions where, even with smaller online populations, the rate of abusive domain registrations is notably high. This insight allows for a more efficient allocation of resources, focusing on the quality of risk rather than just the quantity of internet users.
As the digital landscape continues to expand and new Top-Level Domains (TLDs) emerge, the dynamics of cybersquatting will undoubtedly evolve. Ongoing vigilance, coupled with a nuanced understanding of these global trends and the inherent limitations of available data, will remain indispensable for safeguarding brand integrity in the ever-complex online world. WIPO’s commitment to publishing these statistics provides a vital tool in this ongoing battle, empowering brand owners with the intelligence needed to protect their valuable digital assets effectively.