
Unpacking nTLD Geographic Skew: How Domain Endings Reflect National Preferences
Since 2014, the digital landscape has undergone a significant transformation with the introduction of over a thousand new generic top-level domains (nTLDs). These innovative domain endings have expanded the possibilities for online identity, moving far beyond the traditional .COM, .ORG, or country-code TLDs like .UK or .DE. Among this vast array of new options, some nTLDs are explicitly tied to geographical locations, such as the GEOs like .LONDON, .NYC, and .IRISH. These serve as digital markers for specific cities, regions, or cultural groups, offering a clear sense of place. However, the majority of nTLDs are generic keywords – categories like .CLUB, .FISH, .NINJA, or .ONLINE – which are not inherently rooted in a single physical location.
While some of these generic nTLDs exhibit a relatively uniform registration rate across the globe, others demonstrate a strong predilection towards certain nations. Understanding this national inclination, or “skew,” is crucial for anyone involved in domain name strategy, marketing, or digital branding. This article delves into the fascinating phenomenon of geographic skew, explaining how it’s measured and what insights it offers into the global adoption patterns of nTLDs. Last time, we precisely calculated this “skew” for thousands of country/nTLD pairs. You can refer to the comprehensive table here to see the raw data.
Defining “Skew”: A Measure of Local Peculiarity
At its core, “Skew” provides a quantitative measure of how much a particular nTLD is over or under-represented in a specific country compared to its global prevalence. It’s a powerful metric for identifying unique national preferences in domain registration. The formula for calculating Skew is elegantly simple:
Let’s break down what this formula tells us. The “TLD % of Country” represents the percentage of all domain registrations within a given country that belong to a specific nTLD. For instance, what percentage of all domains registered in Ireland are .IRISH domains? The “TLD % of World” is the global equivalent – the percentage of all domain registrations worldwide that are .IRISH domains. By comparing these two ratios, Skew reveals how much more (or less) popular an nTLD is in a particular country relative to its global average. A higher Skew value indicates a stronger local bias. Conversely, a lower Skew value suggests that the nTLD is less common in that country than it is globally, even if many domains are registered there.
Why Skew Matters: Answering Key Questions
The Skew metric helps us answer a variety of pertinent questions that go beyond simple registration numbers:
- How intense is the preference for .IRISH in Ireland when compared to its adoption across the rest of the planet?
- Among the German-speaking countries – Germany, Switzerland, and Austria – which nation exhibits the strongest bias towards the .KAUFEN (German for ‘buy’) nTLD?
- How pronounced is China’s emphasis on .XYZ domains when contrasted with other popular Chinese-centric nTLDs like .WANG or .世界 (which means ‘world’ in Chinese)?
These questions highlight the nuanced insights Skew offers. It moves beyond raw volume to explore the proportional significance of an nTLD within a specific national context. For businesses targeting particular regions, understanding this bias can inform domain strategy, marketing campaigns, and even product naming conventions. Domain investors can also leverage this data to identify undervalued or overvalued nTLDs within specific geographical markets.
Skew: Measuring Deviation, Not Absolute Popularity
It is absolutely vital to grasp that Skew does not measure local popularity in an absolute sense. A high Skew doesn’t necessarily mean an nTLD has the highest number of registrations in a country; rather, it indicates a significant *deviation* from the global registration rate. Consider Ireland as an example: .TOP actually holds the top spot for registrations in the country, while .IRISH ranks only second, even within the Emerald Isle itself.
Despite its second-place ranking, .IRISH registers an astonishing Skew of 1014.7. This high value signifies a massive departure from the global norm – meaning that Irish residents register .IRISH domains at over a thousand times the global average rate. This clearly shows a powerful national identity or cultural affinity at play. Surprisingly, despite its #1 ranking in absolute registrations, .TOP is registered in Ireland at *less than* the average global rate (Skew = 0.75). This means that while many .TOP domains are registered in Ireland, the country’s residents are proportionally *less* likely to choose a .TOP domain compared to the global internet user base. Essentially, Skew quantifies local idiosyncrasy and national preference, not simply the total volume of local registrations.
The range of Skew values tells an interesting story about domain adoption. At the farthest extreme, we observe compelling cases like .IRISH in Ireland or .CAPETOWN in South Africa, where the country and the specific nTLD occur together at Skew values exceeding 1000 times the worldwide average. These are instances of profound local relevance and adoption. When Skew equals 1, it signifies that the co-occurrence of the country and the TLD perfectly mirrors the global average – there’s no particular bias or deviation. And crucially, when Skew is less than 1, we understand that – even if the country has registered many domains within that TLD – this pairing shows up at less than the global rate, indicating relative underrepresentation or a lack of specific local appeal.
Driving Forces Behind Skew: Beyond Geography
What fundamental factors contribute to such pronounced variations in nTLD adoption? While every country/nTLD pair possesses its unique narrative, certain overarching elements consistently play a significant role. Geo-specific nTLDs (GEOs) are, predictably, the most straightforward case. It’s a safe hypothesis, and indeed, a quantified reality, that registrations for .BERLIN will naturally spike in Germany, .AMSTERDAM will demonstrate a strong skew towards the Netherlands, and Japan will exhibit an undeniable bias towards .TOKYO. These domains are designed to cater to a specific local identity, making their high skew values intuitive.
However, the influence extends beyond mere geographical designation. Other critical factors include:
- Linguistic Relevance: nTLDs like .KAUFEN (German for ‘buy’) will naturally skew towards German-speaking nations (Germany, Austria, Switzerland). Similarly, specialized TLDs in other languages would see higher adoption in countries where those languages are dominant.
- Cultural Identity and Affinity: Beyond explicit GEOs, some nTLDs resonate deeply with a nation’s cultural fabric. .IRISH is a prime example, reflecting a strong sense of national pride. Similarly, domains like .SCOT appeal to Scottish identity, even if Scotland itself isn’t a sovereign state with its own ccTLD in the same way.
- Marketing and Registry Initiatives: The marketing efforts undertaken by the nTLD registry can significantly influence local adoption. Targeted campaigns, partnerships with local registrars, and promotional pricing in specific regions can create artificial or accelerated skew.
- Economic Factors: The cost of registration, local disposable income, and the overall economic health of a country can impact willingness to invest in new domain endings. Regions with robust digital economies might experiment more with nTLDs.
- Local Market Demand and Niche Industries: Certain nTLDs align with prevalent local industries or interests. For example, .FISH might see higher skew in countries with strong fishing industries, or .TECH in nations with burgeoning technology sectors.
- Internet Penetration and Digital Literacy: Countries with high internet penetration rates and a population accustomed to digital innovation might be more open to adopting new, unconventional domain endings.
- Regulatory and Policy Environments: Government-backed initiatives or specific regulations regarding domain ownership can also shape national preferences and skew.
Visualizing Skew: A Histogram Analysis
To truly grasp the distribution of these national biases, visualizing the data is key. Let’s analyze the distribution of Skew values:
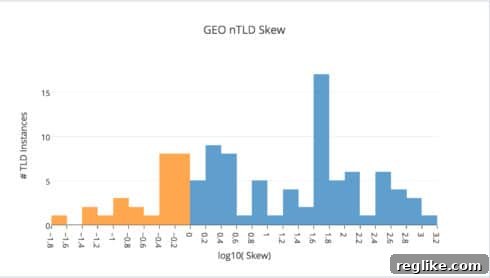
Do not be intimidated by the histogram presented above. The horizontal axis simply represents Skew – the very same numbers you might have encountered in last week’s comprehensive table. The vertical axis counts the number of Country/nTLD pairs that exhibit disproportionate co-occurrence. The reason for employing a logarithmic scale on the horizontal axis is purely practical: it makes the vast range of data viewable and interpretable. Skew values can soar as high as 1000+ and plummet as low as 0.001. To accommodate these extreme variations, large values are compressed, hence the blue section (representing Skew from 1 to 1000+) is displayed from 0 to 3+. Conversely, small values are elongated, so the orange section (representing Skew from 0.001 to 1) is shown from -3 to 0.
If the mechanics of logarithms aren’t fresh in your mind, don’t worry. Here’s a simple table to illustrate the relationship between Skew and its logarithmic representation (base 10):
| Skew | 0.001 | 0.01 | 0.1 | 1.0 | 10 | 100 | 1000 |
|---|---|---|---|---|---|---|---|
| Log10(Skew) | -3 | -2 | -1 | 0 | 1 | 2 | 3 |
As illustrated, the Ireland / .IRISH pair, with its Skew = 1014.7 (which equals 103.01), positions itself at the far right of the blue region, signifying an extremely high positive bias. Meanwhile, Mexico / .LAT, registering a Skew = 615.3 (or 102.79), is counted among the four Country/nTLD pairs falling within the log10(Skew) range of 2.6 to 2.8. The blue area within the histogram robustly represents all instances where Skew ≥ 1.0 – effectively encompassing all cases of positive nTLD bias or overrepresentation in a specific country.
GEO vs. Generic nTLDs: A Stark Contrast in Skew
When we compare the histogram for GEO nTLDs (the first plot) with the subsequent plot that illustrates the distribution for non-GEO, or generic, nTLDs, a striking difference emerges:
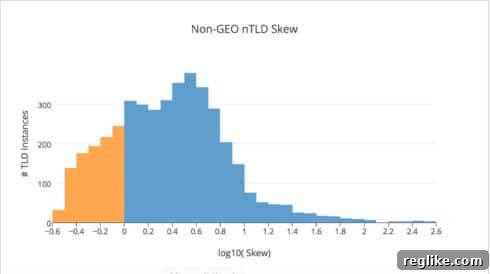
For non-GEO suffixes, relatively few exhibit a log10(Skew) greater than 1. This implies that the vast majority of generic nTLDs have a Skew value less than 10. In practical terms, if a non-GEO nTLD is overrepresented in a particular country, this disproportion is likely to be below a factor of 10. The bias is present, but it’s generally not extreme. This suggests that generic nTLDs, by their very nature, tend to spread more evenly across the global internet landscape, or their biases are subtle rather than overwhelmingly strong.
In stark contrast, GEO nTLD/country pairs deviate from the global average with much greater intensity. Roughly half of the total area of the GEO plot is found within the log10(Skew) range of 1 to 3.2. This critical insight means that GEOs that rank prominently in country-specific charts will be overrepresented in those locations by a factor of 10 to 1000 approximately 50% of the time. This extreme skew is a clear indicator of the strong sense of local identity and immediate relevance that geographical domain endings provide to their intended audiences. For businesses or individuals seeking to establish a strong, locally-rooted online presence, a GEO nTLD offers an unparalleled opportunity to signal immediate belonging and relevance.
Implications for Digital Strategy
Understanding the concept of Skew and its varying degrees across different types of nTLDs has profound implications for digital strategy. For brand managers, this data can inform decisions on which nTLDs to acquire for international markets. A generic TLD with a low Skew might offer broad appeal, while a GEO TLD with a high Skew ensures deep local resonance. For domain investors, Skew analysis can pinpoint undervalued or overlooked nTLDs in specific national markets, suggesting potential for growth or niche specialization. Marketers can use these insights to tailor their campaigns, recognizing that certain domains naturally carry more weight and recognition within particular cultural or geographical contexts.
Conclusion: The Evolving Global Domain Tapestry
The introduction of new top-level domains has undeniably enriched the internet’s naming system, providing unprecedented choice and specificity. However, this expanded choice has also introduced complex patterns of adoption driven by geographic, cultural, and linguistic nuances. Our analysis of “Skew” offers a powerful lens through which to understand these national preferences, distinguishing between mere popularity and genuine local deviation from global norms. The dramatic differences in Skew between GEO and generic nTLDs underscore the varied roles these domain endings play in the digital ecosystem.
As we continue to navigate this evolving global domain tapestry, a deeper exploration of these underlying factors remains essential. In our next article, we will delve deeper into the critical role of language in shaping these national biases and how linguistic affinity further refines the adoption patterns of new domain extensions.